

Two Graphs That Should Terrify Democrats about 2024


I can’t tell you how often I’ve heard people insist that Trump is unelectable in 2024. Many people who support his Republican primary opponents often make this case. As someone who is leaning toward Ron DeSantis, I get it. Frankly, aside from his stellar record, there are plenty of other reasons why I am more comfortable with Ron DeSantis than Trump.
But I’m not buying the argument that Trump is unelectable. Some argue that polling is wrong and that polling outfits are boosting Trump in general election polling to help him win the nomination, assuming he will go down in flames in November next year.
I remember Democrats scoffing at Trump’s viability in the general election in 2016 as well. But, even more so, to buy this theory, you have to believe that respected polling outlets are deliberately inflating Trump’s support at the expense of their reputations. Yes, polling has often been wrong, and pundits have often examined the crosstabs of various polling to demonstrate bias. Absent a compelling argument that multiple reputable polling outfits have been releasing skewed polls, I have to believe that most pollsters are conducting their polls in good faith.
That said, if we assume that polls are no more or less accurate than they have been in past cycles, I’m here to tell you that things look significantly better for Trump today than they did for him back in the 2020 cycle.
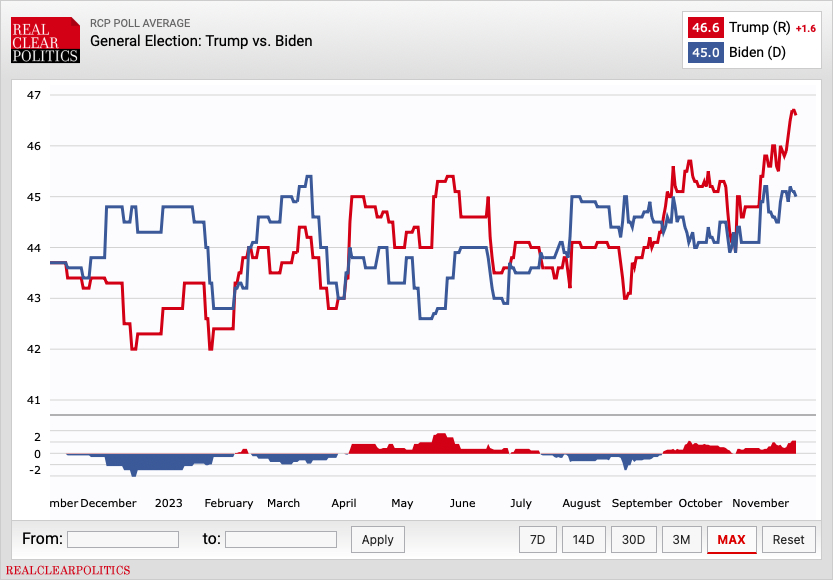
Currently, Trump leads Joe Biden by 1.6 points in the Real Clear Politics average. Four years ago today, Biden had a +10.2 point lead in the Real Clear Politics average. That tells you that a year out from the 2024 election, Trump is in a much better place than he was in 2019, a year before 2020. By the end of the presidential election, Biden’s RCP average was +7.2, and his actual national popular vote advantage was +4.5. Yet, the election was ultimately decided by a few thousand votes in a few select battleground states.
But I really want to demonstrate graphically just how different 2024 looks compared to 2020.
Here’s a graph showing the Real Clear Politics average of polling from November 2, 2022 to the present:
Now look at the following graph showing the Real Clear Politics average of polling from September 1, 2019 to Election Day 2020:
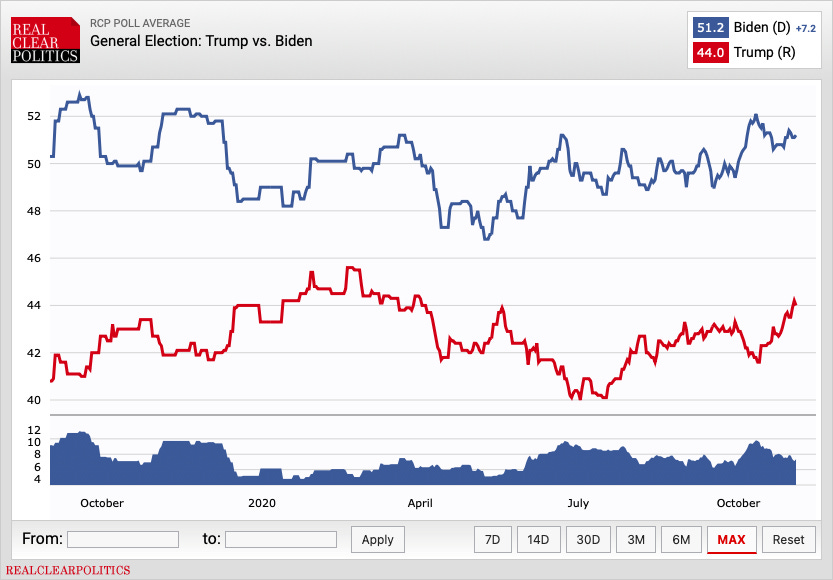
While these graphs cover different time frames relative to the election, what sticks out is that in 2020, Donald Trump never eclipsed Joe Biden in the Real Clear Politics average. At times, Biden even had a double-digit lead. Four years later, not only are the polls significantly tighter that many are calling the election a toss-up, but Trump has led Biden in the RCP average multiple times and is currently leading Biden +1.6 points in that average of the polls. Considering how polling has generally underestimated Trump’s support, it’s evident that Joe Biden is extremely weak heading into the 2024 election compared to his standing in the 2020 election, and Trump, at this point, looks like he could win not only the Electoral College but also the national popular vote.
Yes, pollsters were wrong in 2016 and 2020, but both times they underestimated Trump’s support. In the 2020 cycle, left-leaning pollsters had every reason not to underestimate Trump’s support, yet they did. I suspect the problem has always been that pollsters have failed to understand who Trump voters are or why he appeals to them.
As such, I’m not convinced they’re colluding to overestimate Trump’s support in the 2024 cycle as part of some scheme to manipulate Republican voters to support him. With that in mind, Democrats have every reason to be having a panic attack over the differences in polling trends between 2020 and 2024.